Biodiversity and Nature Risk Edition primer, 10 pages

Print Download PDF

Biodiversity and Nature Risk Edition Nature risk scores for every location, aligned to TNFD, CSRD and the EU Taxonomy

A primer for corporates, banks, investors and insurers on why location decides nature risk, the five scores and the data behind them.

Munich Re example site

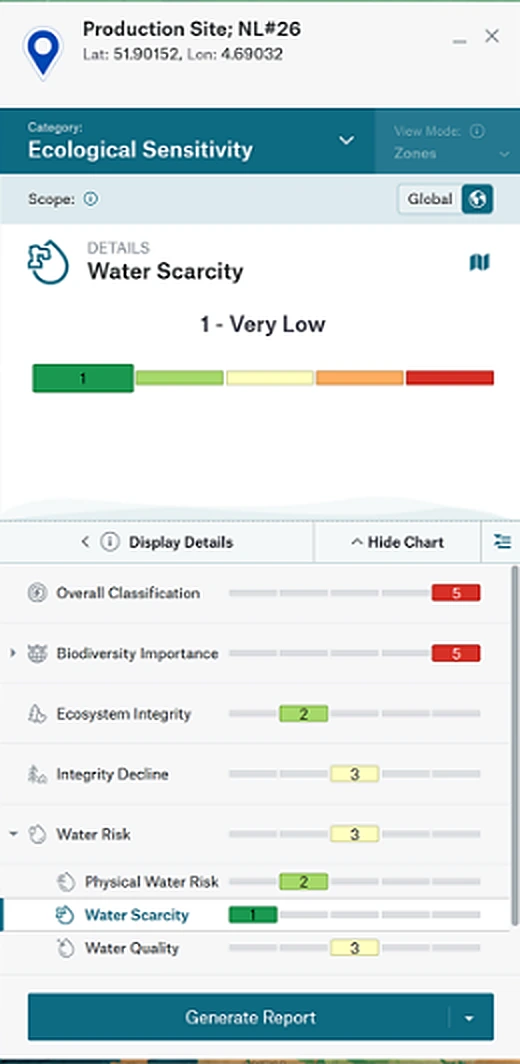
Production Site NL#26

Overall classification5Very high
  • Biodiversity importance5
  • Ecosystem integrity2
  • Integrity decline3
  • Water risk3
  • Ecosystem servicesNot shown

Scores for Production Site NL#26 as shown in Location Risk Intelligence. Map and portfolio markers are schematic illustrations.

01OverviewBiodiversity and Nature Risk Edition

Nature risk data for every location in your portfolio

Biodiversity and Nature Risk Edition gives you decision-ready climate and nature risk data in a single platform. Banks, investors, developers and corporates use it to understand, measure and manage nature risks across assets and portfolios worldwide, aligned to frameworks such as TNFD, CSRD and the EU Taxonomy.

500+

organisations, representing US$17.7tn in assets under management, have committed to TNFD-aligned reporting.1

US$44tn

of economic value, more than half of global GDP, is moderately or highly dependent on nature.2

US$10tn

Cost to the global economy each year from biodiversity loss, according to the World Health Organization.3

81%

of habitats in the EU are in poor status.4

What every location is scored on

  • Biodiversity importance

    Threatened species and the distance to protected and sensitive areas.

  • Ecosystem integrity

    The current level of ecosystem integrity, after human impacts.

  • Integrity decline

    The average yearly decrease in intactness from 2000 to 2020.

  • Water risk

    Physical water risk, water scarcity and water quality.

  • Ecosystem services

    How essential the area is for nature’s benefits to people.

  • Overall ecological sensitivity

    The maximum of the five, to prioritise locations for a closer look.

Four steps in the platform

  1. 01Locate your assets

    Coordinates or addresses, entered one by one or uploaded as an Excel or CSV file.

  2. 02Score each location

    Five scores and one overall score, each sorted into five zones.

  3. 03Compare the zones

    See how many sites, suppliers or assets fall into each zone, per score.

  4. 04Report and integrate

    Generate reports in the platform, or plug the scores into your systems via API.

Book an online demoA Location Risk Intelligence expert takes you through the platform and the five scores.

Book your demo at munichre.com/rmp

1 TNFD, news release “Over 500 organisations and $17.7 trillion AUM now committed to TNFD-aligned risk management and corporate reporting”. 2 World Economic Forum, New Nature Economy Report, 2020. 3 WHO fact sheet Biodiversity, February 2025. 4 European Commission, EU Nature Restoration Law. Figures as cited by Munich Re.

02
02Why location decides nature riskEvidence

A top global risk that plays out site by site

Biodiversity risks are spatially specific. Knowing where operations and assets interface with nature is the first requirement for TNFD-aligned risk management.

Up the global risk rankingRank of biodiversity loss and ecosystem collapse among long-term global risks

No. 1No. 10No. 20No. 30No. 37No. 220092025

Source: World Economic Forum, Global Risks Report 2025, as cited by Munich Re.

US$2.7tn

Possible annual GDP losses by 2030 if key ecosystem services such as pollination, fisheries and forests collapse, according to the World Bank.5

1 in 3

bee and butterfly species in the EU are in decline.6

“Biodiversity is inherently local. The species present, the pressures they face, and the way ecosystems respond can vary dramatically from one place to another.”

Hannah McCartney, Innovation Unit Programme Manager, Natural History Museum, London, in Munich Re’s Re:Brief, March 2026

What disclosure now asks for

  1. TNFDDisclose the locations of assets and activities in direct operations and, where possible, value chains that meet the criteria for priority locations.Recommendations, Strategy D
  2. ESRS E4The locations in own operations behind material impacts, risks and opportunities, and a list of related biodiversity-sensitive areas.Applies from financial year 2027
  3. ISSBConsider the location of assets and activities throughout the value chain, including sensitive locations.Proposed in October 2026
  4. SFDRIndicators for biodiversity principal adverse impacts, such as investments in or near Natura 2000 sites, Key Biodiversity Areas and UNESCO sites.Entity and product level

5 World Bank. 6 European Commission, EU Nature Restoration Law. Figures as cited by Munich Re. TNFD Recommendations, October 2026. Delegated Regulation (EU) 2026/1563, ESRS E4-5. ISSB Exposure Draft ED/2026/1, comments until 19 February 2027. SFDR: Munich Re, Biodiversity and Nature Risk Edition product page.

03
03The five scoresEcological sensitivity

Locate, evaluate, and rank biodiversity and nature risks for every site

A score for every type of ecological sensitivity, so you can prioritise locations quickly. Each score sorts a location into one of five zones, with 1 very low and 5 very high.

Overall ecological sensitivity

Incorporates the maximum of the five scores below, to support prioritisation of sites that potentially have biodiversity and nature risks worthy of closer examination.

Resolution 1 km², depending on the dataset
Calibration global and country
Source Munich Re, IBAT, Natural History Museum

Biodiversity importance

Combines scores for threatened species, proximity to protected areas and Key Biodiversity Areas. Indicates the area’s importance for biodiversity.

  • Threatened Species Prevalence, based on IBAT’s STAR metric, for species within 5 km of the site
  • Proximity to Protected and Conserved Area, the distance to a WDPCA-listed area
  • Proximity to Key Biodiversity Area
  • Proximity to Biodiversity-sensitive Areas, CSRD and EU Taxonomy aligned, with UNESCO World Heritage Sites and Natura 2000 areas

Resolution 5 km²
Calibration global and country
Source Munich Re, IBAT
Ecosystem integrity

Reflects the current level of ecosystem integrity in the area, after taking human impacts into account. Supporting data includes the Natural History Museum’s Biodiversity Intactness Index.

Resolution 10 km
Calibration global and country
Source Munich Re, Natural History Museum

Integrity decline

Categorises the average yearly decrease in the Biodiversity Intactness Index from 2000 to 2020, with past levels for multiple time horizons dating back to 2000.

Resolution 10 km
Calibration global and country
Source Munich Re, Natural History Museum

Water risk

Exposure to physical water risks, with water scarcity and water quality indicators.

  • Physical Water Risk, exposure to river flood, flash flood, storm surge or drought, at 25 m, with JBA Risk Management
  • Water Scarcity, a freshwater deficit potentially challenging to people or ecosystems
  • Water Quality, the condition of local waterways based on 10 quality indicators

Resolution 25 m
Calibration global
Source Munich Re

Ecosystem services

Shows how essential an area is for nature’s benefits to people, such as flood protection, pollination, fisheries and fodder production. Supporting data includes the distance to indigenous communities.

Resolution 10 km
Coverage global
Source Munich Re

1 Very low2 Low3 Medium4 High5 Very high

Definitions, resolutions and sources: Munich Re, Biodiversity and Nature Risk Edition brochure and product page. Pictograms © Munich Re. Supporting data is provided to subscription clients.

04
04In the platformLocation Risk Intelligence

Examine entire portfolios and single locations

View nature risk side by side with physical climate risk. Screen a whole portfolio, then open any site for every score behind it.

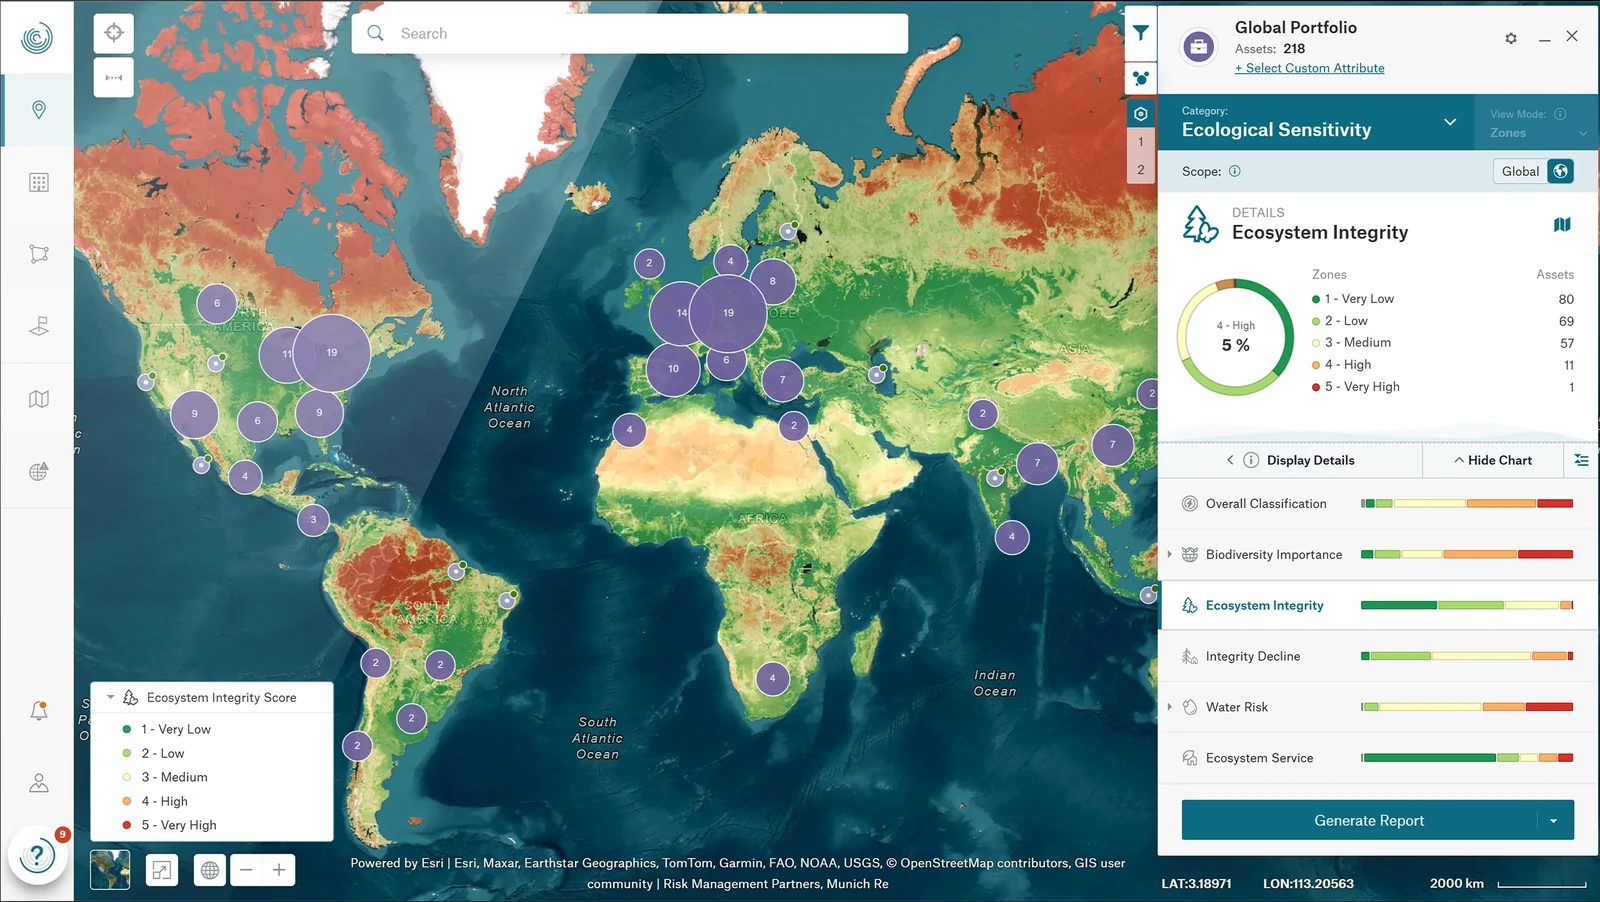
Global portfolio of 218 assets in Location Risk Intelligence, ecological sensitivity view12
Site panel for Production Site NL#26 with its ecological sensitivity scores34
  1. 1
    Map your portfolio

    Every site appears on the map, clustered by region, here a global portfolio of 218 assets.

  2. 2
    Compare the zones

    The zone view counts the assets in each class, for every score.

  3. 3
    Drill into a single site

    Production Site NL#26 shows an overall classification of 5, very high, the same as its Biodiversity Importance score.

  4. 4
    Report and integrate

    Generate a report in the platform, or retrieve the scores via API.

Ecosystem integrity across 218 assets

Assets per zone, Munich Re example portfolio

1 Very low80
2 Low69
3 Medium57
4 High11
5 Very high1

Munich Re. Source: Location Risk Intelligence screenshot.

Screenshots © Munich Re. Map tiles © Esri and contributors. Portfolio and site are Munich Re examples in Location Risk Intelligence.

05
05Where the data comes fromMunich Re, IBAT, Natural History Museum

IBAT and Natural History Museum data, scored by Munich Re

Direct access to IBAT or the Biodiversity Intactness Index delivers raw scientific data that requires significant technical capability to consolidate and harmonise. Biodiversity and Nature Risk Edition integrates all sources into a single structured platform.

Each score sits where its sources overlap. Every location gets all five scores and the overall score, each in one of five zones.

IBATSpecies andprotected areasNatural HistoryMuseumBiodiversityIntactness IndexMunich ReHazard and risk modelsBiodiversityimportanceEcosystemintegrityIntegritydeclineWater riskEcosystemservicesOverall

IBAT

The Integrated Biodiversity Assessment Tool, operated by BirdLife International, Conservation International, IUCN and UNEP-WCMC.

310,000+
protected areas and OECMs in 245 countries and territories, updated monthly
160,000+
peer-reviewed species assessments on the IUCN Red List
11
standardised criteria for Key Biodiversity Areas, updated twice a year

Natural History Museum

The Biodiversity Intactness Index shows the estimated percentage of the original number of species that remain, and their abundance, in any given area.

6 million
data observations
76,000
unique species
50,000
sites measured

Munich Re

Decades of natural hazard risk assessment and risk modelling contribute mainly to the ecosystem services score, the water-related risk scores and the nature risk scores.

140+ years
of natural hazard expertise
25 m
resolution for physical water risk, with JBA Risk Management

“Beside the rigorous validation, these datasets are also regularly updated, which matters for annual reporting. For companies, it’s important that the data referenced today will be consistent in four years’ time.”

Joanna Karlic, Partnerships Lead, IBAT, in Munich Re’s Re:Brief, June 2026

Figures as published by Munich Re in The Re:Brief interviews with IBAT and the Natural History Museum, 2026. Score sources: Munich Re, Biodiversity and Nature Risk Edition brochure.

06
06How the scores support disclosureFrameworks and regulation

Fulfil disclosure requirements and simplify reporting

The five scores follow the five types of sensitive location in the TNFD recommendations. GRI 101 and the proposed ISSB Practice Statement name the same five.

ScoreSensitive locationTNFDGRI 101-5ISSBProposal, comments until
19 February 2027
Biodiversity importanceAreas important for biodiversity
Ecosystem integrityAreas of high ecosystem integrity
Integrity declineAreas of rapid decline in ecosystem integrity
Water riskAreas of high physical water risk
Ecosystem servicesAreas important for ecosystem service provision

For corporates

  • TNFD

    Operationalise the Locate and Evaluate steps of TNFD’s LEAP process efficiently and at scale.

    500+ organisations committed
  • CSRD

    ESRS E4: mapping of sites, ecosystems, threatened species, protected areas, dependencies and impact. ESRS E3: screening for water-stressed and water scarcity areas, with 10 water quality indicators.

    Revised ESRS from financial year 2027
  • EU Taxonomy

    Objective 6, Biodiversity and Ecosystems. Geospatial checks for activities “in or near biodiversity sensitive areas” and asset-level screening for Do No Significant Harm.

    Appendix D: Natura 2000, UNESCO sites and KBAs
  • CSDDD

    Site-specific mapping and data to identify, prevent and mitigate adverse environmental impacts in operations and value chains.

    Applies from 26 July 2029
  • EU Nature Restoration Law

    Location-based data to align with EU targets to restore 20% of land and sea by 2030.

    Regulation (EU) 2024/1991
  • EIA Directive

    Site-specific data on species, habitats and cumulative effects, also for the Appropriate Assessment under the Habitats Directive.

    Directive 2011/92/EU, as amended

For banks, investors and insurers

  • SFDR

    Indicators for biodiversity principal adverse impacts, at entity and product level. Screen portfolios for assets in or near Natura 2000 sites, Key Biodiversity Areas and UNESCO sites.

  • EBA Pillar 3

    Location-specific data and analysis for the Pillar 3 ESG standards that require EU banks to disclose risks from climate change and biodiversity loss.

  • ECB

    Location-based evaluation to meet ECB expectations on climate and environmental risks, including nature, and to integrate them across governance.

  • NGFS

    Metrics aligned with the NGFS conceptual framework for nature-related risks, a common language and supervisory direction for financial risks from nature.

  • EIOPA and Solvency II

    Solvency II, Directive (EU) 2025/2, requires insurers to identify, measure and manage biodiversity-related risks in underwriting and investments.

Framework texts: Munich Re, Biodiversity and Nature Risk Edition. Sensitive locations: TNFD Recommendations, October 2026, Strategy D. GRI 101: Biodiversity 2024, Disclosure 101-5. ISSB ED/2026/1, paragraph B32. Dates: TNFD, 15 October 2026, Delegated Regulation (EU) 2026/1563, Directive (EU) 2026/470.

07
Two colleagues reviewing data on a laptop in a green office
07Who uses itTeams and sectors

Use cases in reporting, risk and investment

  • Reporting

    Assess ecosystem importance, integrity, water stress and ecosystem service provisioning all within one solution to streamline EU Taxonomy and CSRD reporting.

  • Third-party risk management

    Identify nature risks and impacts within your value chain so you can mitigate potential disruption. Anticipate ecosystem changes to maintain business continuity.

  • Strategic planning

    Locate dependencies on ecologically sensitive areas to evaluate biodiversity and nature risks, and the opportunities that come with them.

  • Risk management

    Anticipate business interruptions, price hikes and potential lawsuits arising from nature risks and ecosystem decline.

  • Real estate investment

    Use uniform scientific data to identify ecologically sensitive areas. Reduce nature risk exposure or restore ecosystems to increase property valuation.

  • Credit risk assessment

    Prevent loan defaults by identifying portfolio exposure to possible biodiversity loss or nature risks.

By sector

  • Corporates

    CSRD and EU Taxonomy compliance, CSDDD supply chain due diligence, and water risk and ecosystem services dependencies.

  • Banks, asset managers and insurers

    Portfolio risk assessment, Pillar 3 ESG disclosure and PAI reporting.

  • Real estate investors

    Screening for ecologically sensitive locations and reputational risk.

Use cases: Munich Re, Biodiversity and Nature Risk Edition product page. Sectors: Munich Re, Biodiversity and Nature Risk Edition FAQ. Photo: © Munich Re, Henrik Sorensen / Getty Images.

08
08Why Munich RePartners and proof

Based on Munich Re’s more than 140 years of risk expertise

140+ yearsof natural hazard expertise from Munich Re
ISO 27001Certified information security management
Unlimitedusers, with a web front-end and an API interface
2 daysto get started with Location Risk Intelligence
Portrait of Nitika Agarwal

“Clients tell us that having a strong nature strategy helps strengthen stakeholder and investor confidence.”

Nitika Agarwal, Managing Director, IBAT
Portrait of Hannah McCartney

“If we’re serious about safeguarding the natural systems that underpin our economies and societies, we need robust data to guide decisions.”

Hannah McCartney, Innovation Unit Programme Manager, Natural History Museum, London
Portrait of Joanna Karlic

“Bringing IBAT data as a layer alongside physical climate risk data is the start of a very powerful way for companies to look at climate and nature risk in an interconnected manner.”

Joanna Karlic, Partnerships Lead, IBAT

Get started within 2 days

  1. Choose your edition of Location Risk Intelligence and the risk data you need.
  2. Munich Re activates your account and onboards you to the cloud-based platform.
  3. Run your first single-asset or portfolio risk assessment, guided by the tool.

Quotes and photos: Munich Re, The Re:Brief, 2026. ISO 27001 certification of the information security management system: Munich Re, Risk Management Partners.

09

Book an online demo

with a Location Risk Intelligence expert from Munich Re

The expert takes you through the platform, the five scores and the data behind them.

Book your demo nowmunichre.com/rmp

Sources

  1. TNFD, news release on 500+ organisations and US$17.7tn AUM. TNFD Recommendations, October 2026.
  2. World Economic Forum, New Nature Economy Report, 2020, and Global Risks Report 2025. World Bank. WHO fact sheet Biodiversity, 2025. European Commission, EU Nature Restoration Law. Figures as cited by Munich Re.
  3. Delegated Regulation (EU) 2026/1563. Directive (EU) 2026/470. Regulation (EU) 2024/1991.
  4. GRI 101: Biodiversity 2024. ISSB Exposure Draft ED/2026/1, October 2026.
  5. Munich Re, The Re:Brief interviews with IBAT and the Natural History Museum, 2026.

Imprint

© 2026 Munich Re Service GmbH, Risk Management Partners
Königinstr. 107, 80802 Munich, Germany
Tel.: +49 (0)89 3891-0, Fax: +49 (0)89 399056
Email: Risk-Management-Partners@munichre.com, munichre.com/rmp

Munich Re Service GmbH is a 100% affiliate company of Münchener Rückversicherungs-Gesellschaft Aktiengesellschaft in München (Munich Reinsurance Company). It is a capital company with limited liability with the following object: Development, marketing and distribution of products and services in the field of digital technologies, in particular for risk measurement, risk management and general business optimization.

Picture credits: Getty Images. Product screenshots © Munich Re. Maps in this primer are schematic illustrations, not model output.